
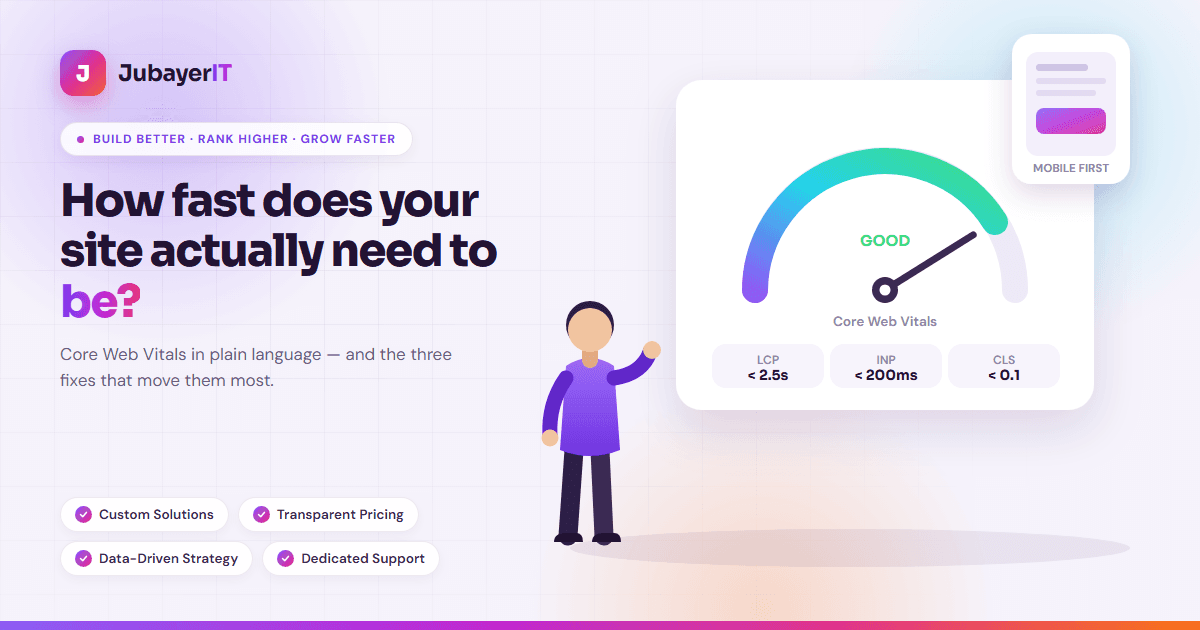
“Make it faster” is the least useful piece of advice in web development. Faster than what? Measured how? On whose phone?
Google answered that with Core Web Vitals — three specific measurements, each with a published threshold, taken from real visits by real people on real connections. They are not a lab score you can game. Here is what each one means, what actually breaks it, and the small number of fixes that move all three.
The three numbers
LCP — Largest Contentful Paint (target: under 2.5 seconds)
How long until the biggest thing on screen finishes rendering. On most business sites that is the hero image or the headline. It answers the visitor's real question: “has this page loaded yet?”
What breaks it: an enormous hero image, a slow server, render-blocking CSS and fonts, or a hero that is drawn by JavaScript after everything else has finished.
INP — Interaction to Next Paint (target: under 200 milliseconds)
When someone taps a button, opens a menu or types in a field, how long before the page visibly responds. INP replaced the older First Input Delay metric in 2024, and it is stricter: it looks at interactions through the whole visit, not just the first one.
What breaks it: too much JavaScript running on the main thread. Chat widgets, heavy analytics stacks, carousel libraries and a long tail of plugins each doing a little work adds up to a page that feels sticky.
CLS — Cumulative Layout Shift (target: under 0.1)
How much the page jumps around while loading. You know the feeling: you go to tap a link, an ad or banner loads above it, and you tap the wrong thing.
What breaks it: images and iframes without width and height, fonts that swap and change the text size, and banners injected at the top of the page after render.
Where to see your real numbers
There are two kinds of measurement and people mix them up constantly:
- Lab data — a simulated load, run on demand. PageSpeed Insights and Lighthouse give you this. Useful for debugging, because it tells you exactly which element is at fault.
- Field data — what actually happened to real Chrome users over the last 28 days. This is what Google uses. You will find it in the Core Web Vitals report in Search Console, and at the top of a PageSpeed Insights report when your site has enough traffic.
Trust the field data for decisions and the lab data for diagnosis. A perfect lab score with failing field data usually means real visitors are on slower devices and networks than your test machine — which, for most businesses in Bangladesh, they are.
The fixes that actually move the numbers
You can spend weeks micro-optimising. In practice, three things account for most of the gap on most sites.
1. Images
This is almost always the biggest single win. A 3 MB photo straight from a phone camera, displayed in a 600-pixel-wide slot, wastes almost all of what it downloads.
- Serve modern formats — WebP or AVIF instead of JPEG and PNG.
- Resize to the size actually displayed, and serve smaller versions to phones.
- Always set
widthandheightso the browser reserves the space — this is the single easiest CLS fix. - Lazy-load images below the fold, but never the hero image: that one is your LCP and should load as early as possible.
2. What you load, and when
Every third-party script is a decision. Live chat, heat maps, three analytics tools, a review widget, a popup builder — each is a request, a parse and some main-thread work. Open your site's network panel and ask of each one: is this earning its cost?
On WordPress specifically, plugin count matters less than what the plugins load. One page-builder that ships its whole stylesheet on every page can cost more than ten small plugins.
3. Hosting and caching
If the server takes 800 ms to produce the HTML, no amount of front-end tuning gets LCP under 2.5 seconds. Cheap shared hosting is usually the invisible ceiling. A better host, page caching, and a CDN serving assets from somewhere near your visitors move every metric at once.
What speed does and does not do
Being fast will not lift you above a page that answers the search better than yours. Core Web Vitals is a tiebreaker, not a trump card. What it does reliably is stop you losing — losing rankings against an equally good competitor, and losing visitors who leave before the page appears.
The honest framing: speed rarely wins the ranking on its own, but it loses it quietly, and it costs you conversions whether or not it costs you a position.
A sensible order of work
- Open the Core Web Vitals report in Search Console and note which of the three is failing, on mobile.
- Run PageSpeed Insights on your two most important pages to find the specific element responsible.
- Fix images first — format, dimensions, and explicit width/height.
- Remove or defer the third-party scripts you cannot justify.
- Only then consider a hosting or caching change, which is the biggest lift and the biggest cost.
- Re-check the field data after four weeks — it is a 28-day rolling window, so it will not move overnight.
If you would like us to run through this on your site and tell you which of the three is actually hurting you, send us the address.